The Karnaugh Map reduces the need for extensive calculations by taking advantage of human's pattern-recognition capability.
It also permits the rapid identification and elimination of potential race conditions.
Here's an example of the Karnaugh Map.

The Karnaugh Map also provides a pictorial method of grouping together expressions with common factors and therefore eliminating unwanted variables.
The Karnaugh Map can also be described as a special arrangement of a Truth Table.
The diagram below shows the correspondence between the Karnaugh Map and the Truth Table for the general case of a two variable problem.

The values inside the squares are copied from the output column of the Truth Table , therefore there is one square in the map for every row in the Truth Table.
Around the edge of the Karnaugh Map are the values of the two input variable.
A is along the top and B is down the left hand side.
The diagram below explains this :

The values around the edge of the map can be thought of as coordinates. So an example , the square on the top right hand corner of the map in the above diagram has coordinates A=1 and B=0. This square corresponds to the row in the truth table where A=1 , B=0 and F=1.
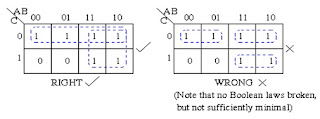
Rules of simplification
Groups may not include any cell containing a zero .
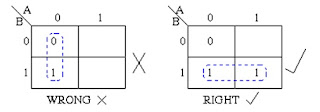
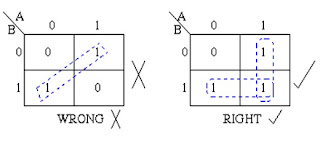
Groups may be horizontal or vertical, but not diagonal.
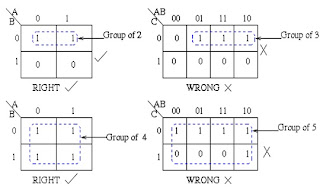
Groups must contain 1, 2, 4, 8, or in general 2n cells.
That is if n = 1, a group will contain two 1's since 21 = 2.
If n = 2, a group will contain four 1's since 22 = 4.
Each group should be as large as possible.
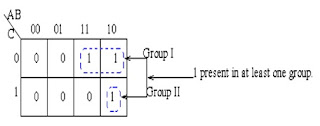
Each cell containing a one must be in at least one group.